Search for Indicators
High School Youth Risk Behavior Survey (YRBS)
The Centers for Disease Control and Prevention's Youth Risk Behavior Surveillance System (YRBSS) is a set of surveys that monitor health behaviors and experiences of students nationwide, including the High School Youth Risk Behavior Survey (YRBS). This survey is conducted nationally every other year among 9th-12th grade students. Health topics covered in the survey include unintentional injuries and violence, tobacco use, alcohol and other drug use, sexual behaviors, dietary behaviors, physical activity, weight, and other topics (e.g., sleep, mental health, etc.).
This dashboard includes select indicators from the High School YRBS for the state of Ohio and city of Cleveland. Subgroup data is available by gender, race/ethnicity, and sexual orientation, depending on the location selected. Select a location using the drop-down menu below. Click on an indicator to navigate to the Indicator Detail page where you can read more about the indicator.
Indicator Gauge Icon Legend
Legend Colors
Red is bad, green is good, blue is not statistically different/neutral.
Compared to Distribution
 the value is in the best half of communities.
 the value is in the 2nd worst quarter of communities.
 the value is in the worst quarter of communities.
Compared to Target
 meets target;
  does not meet target.
Compared to a Single Value
 lower than the comparison value;
 higher than the comparison value;
 not statistically different from comparison value.
Trend

 non-significant change over time;
 significant change over time;
  no change over time.
Compared to Prior Value
 higher than the previous measurement period;
 lower than the previous measurement period;
 no statistically different change from previous measurement period.
 Significantly better than the overall value
 Significantly worse than the overall value
 Significantly different than the overall value
 No significant difference with the overall value
 No data on significance available
Value
Compared to:
State: Ohio High School Students Who Attempted Suicide
State: Ohio High School Students Who Attempted Suicide
9.5%
(2021)
Compared to:
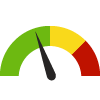
U.S. States
The distribution is based on data from 42 U.S. states and the District of Columbia.
US Value
(10.2%)
The regional value is compared to the national value.
Prior Value
(6.8%)
Prior Value compares a measured value with the previously measured value. Confidence intervals were taken into account in determining the direction of the comparison.
State: Ohio Teen Fruit Consumption
State: Ohio Teen Fruit Consumption
19.5%
(2021)
Compared to:

US Value
(24.2%)
The regional value is compared to the national value.
Prior Value
(22.9%)
Prior Value compares a measured value with the previously measured value. Confidence intervals were taken into account in determining the direction of the comparison.
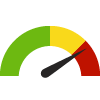
State: Ohio Teen Vegetable Consumption
State: Ohio Teen Vegetable Consumption
7.1%
(2021)
Compared to:
U.S. States
The distribution is based on data from 35 U.S. states.
US Value
(11.2%)
The regional value is compared to the national value.
Prior Value
(11.1%)
Prior Value compares a measured value with the previously measured value. Confidence intervals were taken into account in determining the direction of the comparison.
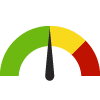
State: Ohio Teens who are Obese: High School Students
State: Ohio Teens who are Obese: High School Students
18.8%
(2021)
Compared to:

U.S. States
The distribution is based on data from 44 U.S. states and the District of Columbia.
US Value
(16.3%)
The regional value is compared to the national value.
Prior Value
(16.8%)
Prior Value compares a measured value with the previously measured value. Confidence intervals were taken into account in determining the direction of the comparison.
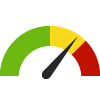
State: Ohio Teens who are Overweight
State: Ohio Teens who are Overweight
13.4%
(2021)
Compared to:
U.S. States
The distribution is based on data from 44 U.S. states and the District of Columbia.
US Value
(16.0%)
The regional value is compared to the national value.
Prior Value
(12.2%)
Prior Value compares a measured value with the previously measured value. Confidence intervals were taken into account in determining the direction of the comparison.
State: Ohio Teens who are Overweight or Obese
State: Ohio Teens who are Overweight or Obese
32.2%
(2021)
Compared to:

U.S. States
The distribution is based on data from 44 U.S. states and the District of Columbia.
US Value
(32.3%)
The regional value is compared to the national value.
Prior Value
(29.0%)
Prior Value compares a measured value with the previously measured value. Confidence intervals were not taken into account in determining the direction of the comparison.
State: Ohio Teens who Binge Drink: High School Students
State: Ohio Teens who Binge Drink: High School Students
12.6%
(2021)
Compared to:
U.S. States
The distribution is based on data from 41 U.S. states and the District of Columbia.
US Value
(10.5%)
The regional value is compared to the national value.
Prior Value
(13.4%)
Prior Value compares a measured value with the previously measured value. Confidence intervals were taken into account in determining the direction of the comparison.
49.4%
(2021)
Compared to:
U.S. States
The distribution is based on data from 44 U.S. states and the District of Columbia.
US Value
(45.3%)
The regional value is compared to the national value.
Prior Value
(43.1%)
Prior Value compares a measured value with the previously measured value. Confidence intervals were taken into account in determining the direction of the comparison.
State: Ohio Teens who have ever had Sexual Intercourse
State: Ohio Teens who have ever had Sexual Intercourse
33.1%
(2021)
Compared to:
U.S. States
The distribution is based on data from 31 U.S. states and the District of Columbia.
US Value
(30.0%)
The regional value is compared to the national value.
Prior Value
(37.7%)
Prior Value compares a measured value with the previously measured value. Confidence intervals were taken into account in determining the direction of the comparison.
State: Ohio Teens who have Used Methamphetamines
State: Ohio Teens who have Used Methamphetamines
1.6%
(2021)
Compared to:
U.S. States
The distribution is based on data from 36 U.S. states and the District of Columbia.
US Value
(1.8%)
The regional value is compared to the national value.
State: Ohio Teens who Smoke Cigarettes: High School Students
State: Ohio Teens who Smoke Cigarettes: High School Students
3.3%
(2021)
Compared to:
U.S. States
The distribution is based on data from 43 U.S. states and the District of Columbia.
US Value
(3.8%)
The regional value is compared to the national value.
Prior Value
(4.9%)
Prior Value compares a measured value with the previously measured value. Confidence intervals were taken into account in determining the direction of the comparison.
State: Ohio Teens who Use Alcohol
State: Ohio Teens who Use Alcohol
22.8%
(2021)
Compared to:
U.S. States
The distribution is based on data from 43 U.S. states and the District of Columbia.
US Value
(22.7%)
The regional value is compared to the national value.
Prior Value
(25.9%)
Prior Value compares a measured value with the previously measured value. Confidence intervals were taken into account in determining the direction of the comparison.
State: Ohio Teens who Use Marijuana: High School Students
State: Ohio Teens who Use Marijuana: High School Students
13.3%
(2021)
Compared to:
U.S. States
The distribution is based on data from 43 U.S. states and the District of Columbia.
US Value
(15.8%)
The regional value is compared to the national value.
Prior Value
(15.8%)
Prior Value compares a measured value with the previously measured value. Confidence intervals were taken into account in determining the direction of the comparison.
