Search for Indicators
Adverse Childhood Experiences (ACEs)
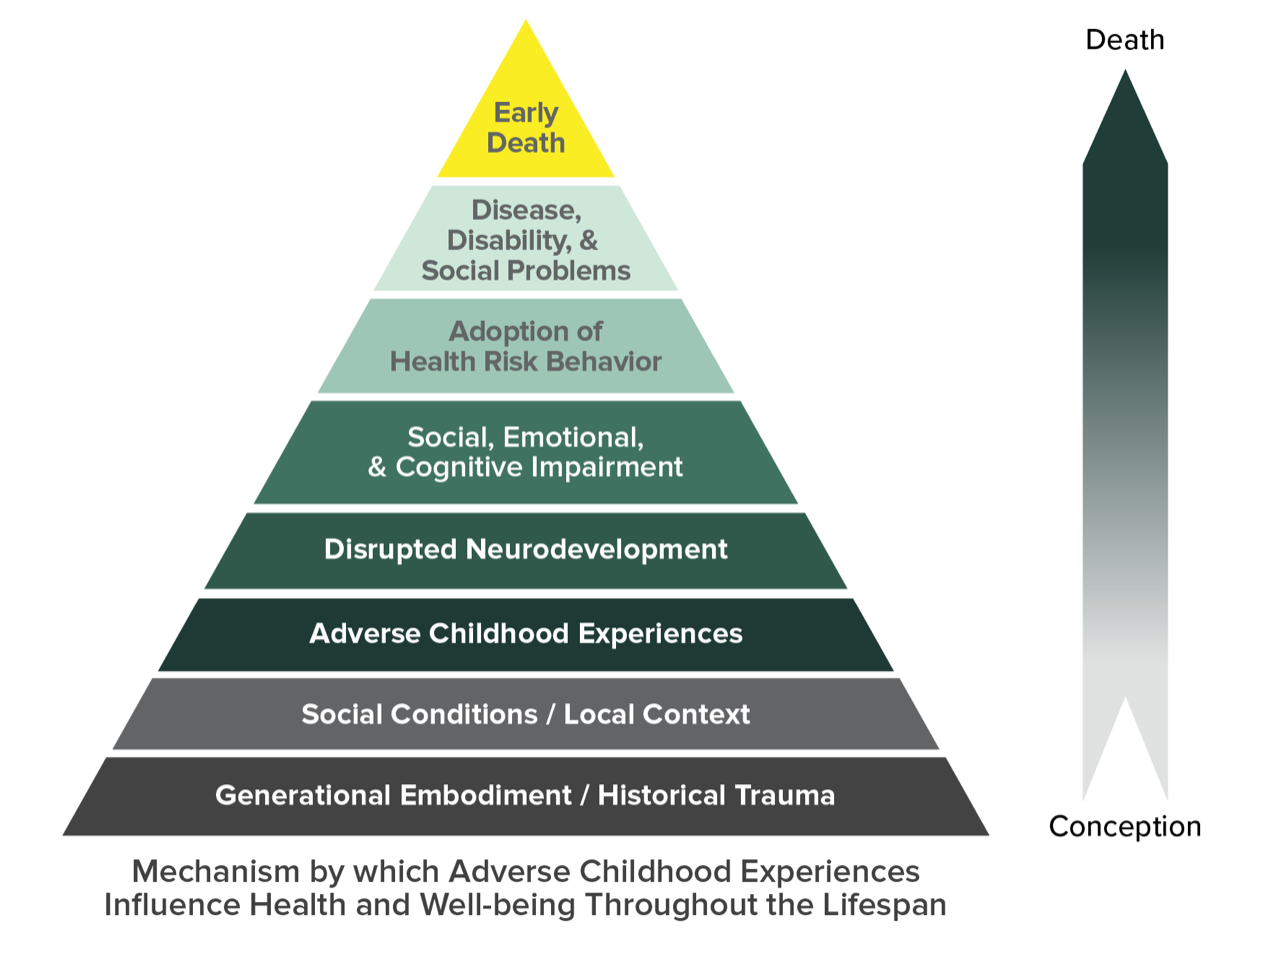
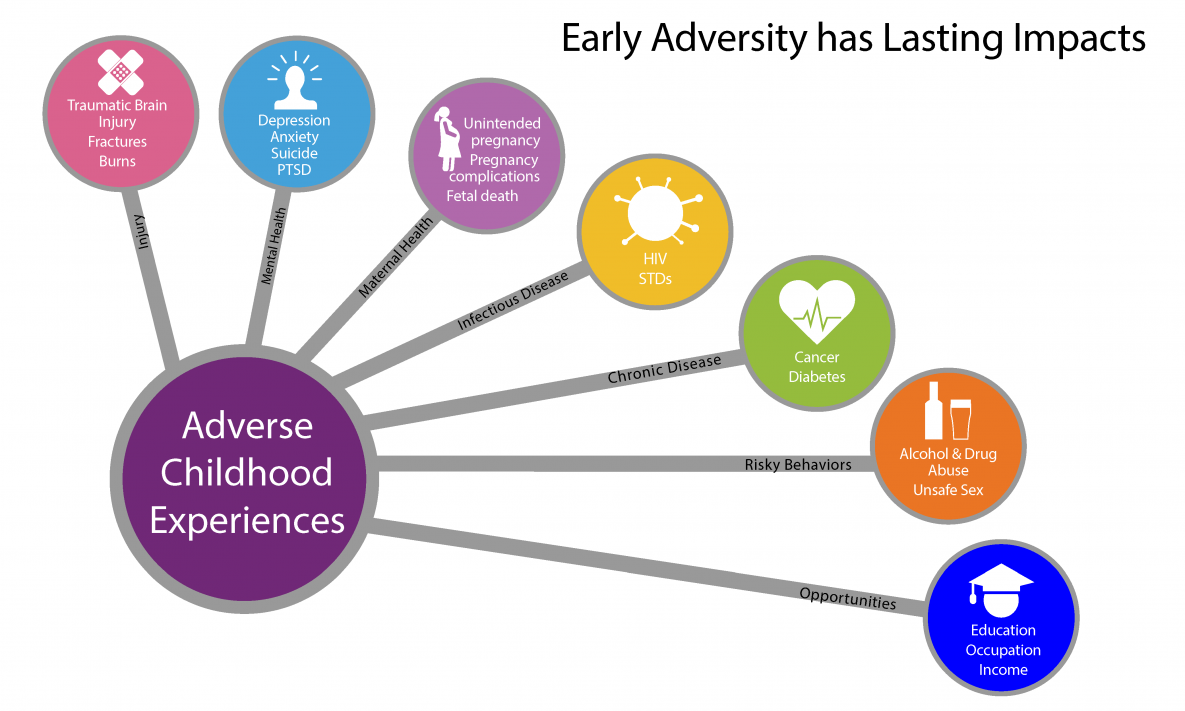
According to the Centers for Disease Control, Adverse Childhood Experiences (ACEs) are potentially traumatic events that occur in childhood that may put children at risk for violence, chronic health problems, mental illness, and substance abuse in adulthood. Examples of ACEs include experiencing violence, abuse, or neglect, and growing up in a household with parental conflict, substance use or mental health problems. As the number of ACEs increases, so does the risk for negative health outcomes and risk behaviors. There are protective factors that can decrease the possibility of experiencing ACEs, such as creating safe and stable relationships and environments for all children.
This dashboard includes indicators related to ACEs. Select a location using the drop-down list below. Click on an indicator to navigate to the Indicator Detail page where you can read more about the indicator.
View ACEs Graphics:
-
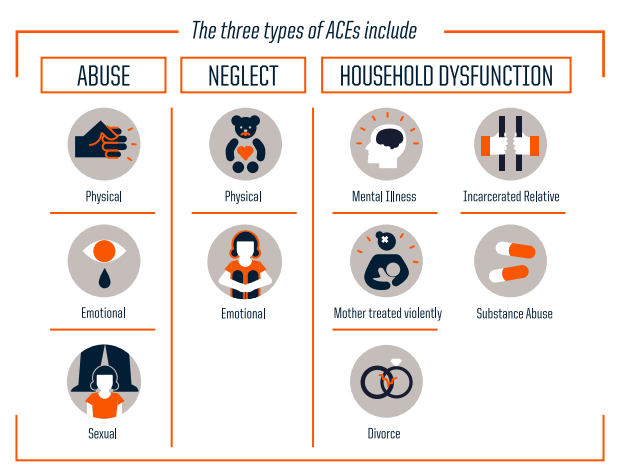 Source: Robert Wood Johnson Foundation
 -
-
-
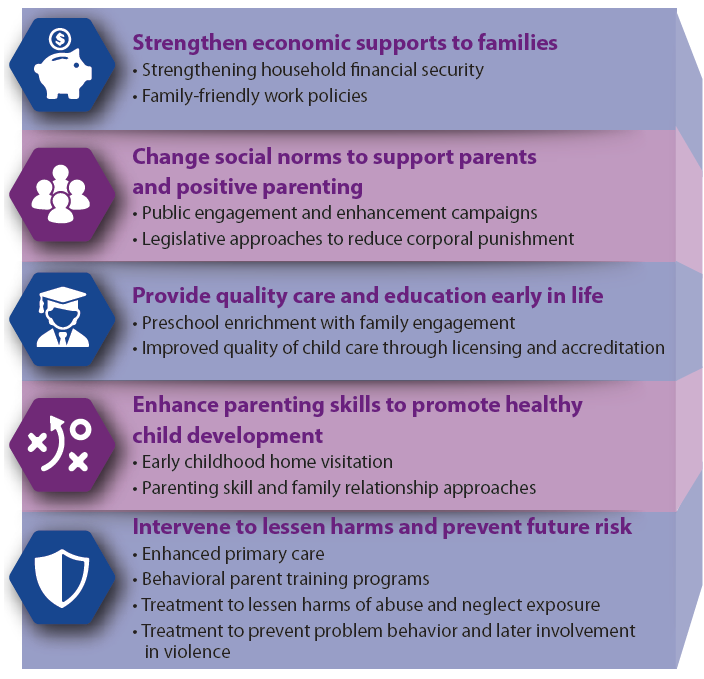 Source: Fortson, B. L., Klevens, J., Merrick, M. T., Gilbert, L. K., & Alexander, S. P. (2016). Preventing child abuse and neglect: A technical package for policy, norm, and programmatic activities. Atlanta, GA: National Center for Injury Prevention and Control, Centers for Disease Control and Prevention.
ACEs Resource Collection
View ACEs-related resources in the Resource Library.
Centers for Disease Control ACEs Page
Access ACEs-related information and resources.
Local Efforts
Learn more about the Cuyahoga County Board of Health's ACEs Program.
Indicator Gauge Icon Legend
Legend Colors
Red is bad, green is good, blue is not statistically different/neutral.
Compared to Distribution
 the value is in the best half of communities.
 the value is in the 2nd worst quarter of communities.
 the value is in the worst quarter of communities.
Compared to Target
 meets target;
  does not meet target.
Compared to a Single Value
 lower than the comparison value;
 higher than the comparison value;
 not statistically different from comparison value.
Trend

 non-significant change over time;
 significant change over time;
  no change over time.
Compared to Prior Value
 higher than the previous measurement period;
 lower than the previous measurement period;
 no statistically different change from previous measurement period.
County: Cuyahoga
Health / Alcohol & Drug Use
Value
Compared to:
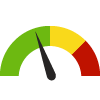
County: Cuyahoga Adults who Binge Drink
County: Cuyahoga Adults who Binge Drink
15.8%
(2021)
Compared to:

OH Counties
The distribution is based on data from 88 Ohio counties.
U.S. Counties
The distribution is based on data from 3,074 U.S. counties and county equivalents.
US Value
(15.5%)
The regional value is compared to the national value.
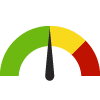
County: Cuyahoga Adults who Drink Excessively
County: Cuyahoga Adults who Drink Excessively
17.1%
(2021)
Compared to:
OH Counties
The distribution is based on data from 88 Ohio counties.
U.S. Counties
The distribution is based on data from 3,141 U.S. counties and county equivalents.
OH Value
(20.0%)
The regional value is compared to the Ohio State value.
US Value
(18.1%)
The regional value is compared to the national value.
Prior Value
(19.9%)
Prior Value compares a measured value with the previously measured value. Confidence intervals were taken into account in determining the direction of the comparison.
Trend
This comparison measures the indicator’s values over multiple time periods.<br>The Mann-Kendall Test for Statistical Significance is used to evaluate the trend<br>over 4 to 10 periods of measure, subject to data availability and comparability.
County: Cuyahoga Adults Who Have Misused Prescription Drugs
County: Cuyahoga Adults Who Have Misused Prescription Drugs
7.2%
(2019)
Compared to:
Prior Value
(9.3%)
Prior Value compares a measured value with the previously measured value. Confidence intervals were not taken into account in determining the direction of the comparison.
County: Cuyahoga Adults Who Have Used Heroin/Fentanyl
County: Cuyahoga Adults Who Have Used Heroin/Fentanyl
0.3%
(2019)
Compared to:
Prior Value
(0.5%)
Prior Value compares a measured value with the previously measured value. Confidence intervals were not taken into account in determining the direction of the comparison.
County: Cuyahoga Adults Who Have Used Recreational Drugs
County: Cuyahoga Adults Who Have Used Recreational Drugs
16.9%
(2019)
Compared to:

Prior Value
(9.9%)
Prior Value compares a measured value with the previously measured value. Confidence intervals were not taken into account in determining the direction of the comparison.
County: Cuyahoga Age-Adjusted Drug and Opioid-Involved Overdose Death Rate
County: Cuyahoga Age-Adjusted Drug and Opioid-Involved Overdose Death Rate
39.2
Deaths per 100,000 population
(2018-2020)
Compared to:
OH Counties
The distribution is based on data from 75 Ohio counties.
U.S. Counties
The distribution is based on data from 1,303 U.S. counties and county equivalents.
OH Value
(40.4)
The regional value is compared to the Ohio State value.
US Value
(23.5)
The regional value is compared to the national value.
Prior Value
(43.8)
Prior Value compares a measured value with the previously measured value. Confidence intervals were taken into account in determining the direction of the comparison.
County: Cuyahoga Age-Adjusted Unintentional Opioid-Related Death Rate
County: Cuyahoga Age-Adjusted Unintentional Opioid-Related Death Rate
37.8
Deaths per 100,000 population
(2017)
Compared to:
Prior Value
(38.2)
Prior Value compares a measured value with the previously measured value. Confidence intervals were not taken into account in determining the direction of the comparison.
County: Cuyahoga Death Rate due to Drug Poisoning
County: Cuyahoga Death Rate due to Drug Poisoning
43.2
Deaths per 100,000 population
(2019-2021)
Compared to:
OH Counties
The distribution is based on data from 81 Ohio counties.
U.S. Counties
The distribution is based on data from 1,899 U.S. counties and county equivalents.
OH Value
(42.2)
The regional value is compared to the Ohio State value.
US Value
(27.2)
The regional value is compared to the national value.
HP 2030 Target
(20.7)
<div>SU-03: Reduce drug overdose deaths <strong>(LEADING HEALTH INDICATOR)</strong></div>
County: Cuyahoga Households that Received Substance Abuse Medical Services
County: Cuyahoga Households that Received Substance Abuse Medical Services
1.4%
(2023)
Compared to:


OH Value
(1.3%)
The regional value is compared to the Ohio State value.
US Value
(1.3%)
The regional value is compared to the national value.
Prior Value
(1.4%)
Prior Value compares a measured value with the previously measured value. Confidence intervals were not taken into account in determining the direction of the comparison.
Trend
This comparison measures the indicator’s values over multiple time periods.<br>The Mann-Kendall Test for Statistical Significance is used to evaluate the trend<br>over 4 to 10 periods of measure, subject to data availability and comparability.
County: Cuyahoga
Health / Cancer
Value
Compared to:
County: Cuyahoga All Cancer Incidence Rate
County: Cuyahoga All Cancer Incidence Rate
477.6
Cases per 100,000 population
(2016-2020)
Compared to:
OH Counties
The distribution is based on data from 88 Ohio counties.
U.S. Counties
The distribution is based on data from 2,693 U.S. counties and county equivalents.
OH Value
(465.3)
The regional value is compared to the Ohio State value.
US Value
(442.3)
The regional value is compared to the national value.
Prior Value
(483.9)
Prior Value compares a measured value with the previously measured value. Confidence intervals were taken into account in determining the direction of the comparison.
Trend
This comparison measures the indicator’s values over multiple time periods.<br>The Mann-Kendall Test for Statistical Significance is used to evaluate the trend<br>over 4 to 10 periods of measure, subject to data availability and comparability.
County: Cuyahoga Lung and Bronchus Cancer Incidence Rate
County: Cuyahoga Lung and Bronchus Cancer Incidence Rate
62.3
Cases per 100,000 population
(2016-2020)
Compared to:
OH Counties
The distribution is based on data from 88 Ohio counties.
U.S. Counties
The distribution is based on data from 2,471 U.S. counties and county equivalents.
OH Value
(64.7)
The regional value is compared to the Ohio State value.
US Value
(54.0)
The regional value is compared to the national value.
Prior Value
(63.5)
Prior Value compares a measured value with the previously measured value. Confidence intervals were taken into account in determining the direction of the comparison.
Trend
This comparison measures the indicator’s values over multiple time periods.<br>The Mann-Kendall Test for Statistical Significance is used to evaluate the trend<br>over 4 to 10 periods of measure, subject to data availability and comparability.
County: Cuyahoga Oral Cavity and Pharynx Cancer Incidence Rate
County: Cuyahoga Oral Cavity and Pharynx Cancer Incidence Rate
11.9
Cases per 100,000 population
(2016-2020)
Compared to:

OH Counties
The distribution is based on data from 83 Ohio counties.
U.S. Counties
The distribution is based on data from 1,706 U.S. counties and county equivalents.
OH Value
(12.6)
The regional value is compared to the Ohio State value.
US Value
(11.9)
The regional value is compared to the national value.
Prior Value
(11.5)
Prior Value compares a measured value with the previously measured value. Confidence intervals were taken into account in determining the direction of the comparison.
Trend
This comparison measures the indicator’s values over multiple time periods.<br>The Mann-Kendall Test for Statistical Significance is used to evaluate the trend<br>over 4 to 10 periods of measure, subject to data availability and comparability.
County: Cuyahoga
Health / County Health Rankings
Value
Compared to:
County: Cuyahoga Health Behaviors Ranking
County: Cuyahoga Health Behaviors Ranking
33
(2023)
Compared to:
OH Counties
The distribution is based on data from 88 Ohio counties.
County: Cuyahoga Physical Environment Ranking
County: Cuyahoga Physical Environment Ranking
79
(2023)
Compared to:
OH Counties
The distribution is based on data from 88 Ohio counties.
County: Cuyahoga Social and Economic Factors Ranking
County: Cuyahoga Social and Economic Factors Ranking
80
(2023)
Compared to:
OH Counties
The distribution is based on data from 88 Ohio counties.
County: Cuyahoga
Health / Diabetes
Value
Compared to:
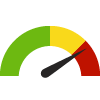
County: Cuyahoga Adults 20+ with Diabetes
County: Cuyahoga Adults 20+ with Diabetes
9.9%
(2021)
Compared to:
OH Counties
The distribution is based on data from 88 Ohio counties.
U.S. Counties
The distribution is based on data from 3,074 U.S. counties and county equivalents.
Prior Value
(9.4%)
Prior Value compares a measured value with the previously measured value. Confidence intervals were taken into account in determining the direction of the comparison.
Trend
This comparison measures the indicator’s values over multiple time periods.<br>The Mann-Kendall Test for Statistical Significance is used to evaluate the trend<br>over 4 to 10 periods of measure, subject to data availability and comparability.
County: Cuyahoga
Health / Health Care Access & Quality
Value
Compared to:
County: Cuyahoga Children with Health Insurance
County: Cuyahoga Children with Health Insurance
95.2%
(2022)
Compared to:


U.S. Counties
The distribution is based on data from 828 U.S. counties and county equivalents.
OH Value
(95.5%)
The regional value is compared to the Ohio State value.
US Value
(94.9%)
The regional value is compared to the national value.
Prior Value
(97.3%)
Prior Value compares a measured value with the previously measured value. Confidence intervals were taken into account in determining the direction of the comparison.
Trend
This comparison measures the indicator’s values over multiple time periods.<br>The Mann-Kendall Test for Statistical Significance is used to evaluate the trend<br>over 4 to 10 periods of measure, subject to data availability and comparability.
County: Cuyahoga
Health / Mental Health & Mental Disorders
Value
Compared to:
County: Cuyahoga Adults Who Have Considered Attempting Suicide
County: Cuyahoga Adults Who Have Considered Attempting Suicide
7.4%
(2019)
Compared to:
Prior Value
(2.0%)
Prior Value compares a measured value with the previously measured value. Confidence intervals were not taken into account in determining the direction of the comparison.
County: Cuyahoga
Health / Tobacco Use
Value
Compared to:
County: Cuyahoga Adults who Smoke
County: Cuyahoga Adults who Smoke
18.0%
(2021)
Compared to:
OH Counties
The distribution is based on data from 88 Ohio counties.
U.S. Counties
The distribution is based on data from 3,074 U.S. counties and county equivalents.
US Value
(13.5%)
The regional value is compared to the national value.
HP 2030 Target
(6.1%)
<div>TU-02: Reduce current cigarette smoking in adults <strong>(LEADING HEALTH INDICATOR)</strong></div>
County: Cuyahoga
Health / Weight Status
Value
Compared to:
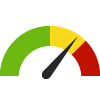
County: Cuyahoga Adults 20+ Who Are Obese
County: Cuyahoga Adults 20+ Who Are Obese
32.5%
(2021)
Compared to:
OH Counties
The distribution is based on data from 88 Ohio counties.
U.S. Counties
The distribution is based on data from 3,074 U.S. counties and county equivalents.
Prior Value
(32.8%)
Prior Value compares a measured value with the previously measured value. Confidence intervals were taken into account in determining the direction of the comparison.
Trend
This comparison measures the indicator’s values over multiple time periods.<br>The Mann-Kendall Test for Statistical Significance is used to evaluate the trend<br>over 4 to 10 periods of measure, subject to data availability and comparability.
HP 2030 Target
(36.0%)
County: Cuyahoga
Community / Crime & Crime Prevention
Value
Compared to:
County: Cuyahoga Violent Crime Rate
County: Cuyahoga Violent Crime Rate
856.5
Crimes per 100,000 population
(2023)
Compared to:

OH Counties
The distribution is based on data from 80 Ohio counties.
OH Value
(359.0)
The regional value is compared to the Ohio State value.
US Value
(380.7 in 2022)
The regional value is compared to the national value. The source for the national value is Federal Bureau of Investigation
Prior Value
(710.5)
Prior Value compares a measured value with the previously measured value. Confidence intervals were not taken into account in determining the direction of the comparison.
Trend
This comparison measures the indicator’s values over multiple time periods.<br>The Mann-Kendall Test for Statistical Significance is used to evaluate the trend<br>over 4 to 10 periods of measure, subject to data availability and comparability.
County: Cuyahoga
Community / Social Environment
Value
Compared to:
County: Cuyahoga Substantiated Child Abuse Rate
County: Cuyahoga Substantiated Child Abuse Rate
9.3
Cases per 1,000 children
(2021)
Compared to:
OH Counties
The distribution is based on data from 88 Ohio counties.
OH Value
(6.9)
The regional value is compared to the Ohio State value.
Prior Value
(10.0)
Prior Value compares a measured value with the previously measured value. Confidence intervals were not taken into account in determining the direction of the comparison.
Trend
This comparison measures the indicator’s values over multiple time periods.<br>The Mann-Kendall Test for Statistical Significance is used to evaluate the trend<br>over 4 to 10 periods of measure, subject to data availability and comparability.
HP 2030 Target
(8.7)
County: Cuyahoga Children in Single-Parent Households
County: Cuyahoga Children in Single-Parent Households
37.8%
(2018-2022)
Compared to:
OH Counties
The distribution is based on data from 88 Ohio counties.
U.S. Counties
The distribution is based on data from 3,132 U.S. counties and county equivalents.
OH Value
(26.4%)
The regional value is compared to the Ohio State value.
US Value
(24.9%)
The regional value is compared to the national value.
Trend
This comparison measures the indicator’s values over multiple time periods.<br>The Mann-Kendall Test for Statistical Significance is used to evaluate the trend<br>over 4 to 10 periods of measure, subject to data availability and comparability.
County: Cuyahoga
Economy / Employment
Value
Compared to:
County: Cuyahoga Unemployed Workers in Civilian Labor Force
County: Cuyahoga Unemployed Workers in Civilian Labor Force
2.9%
(November 2023)
Compared to:
OH Counties
The distribution is based on data from 88 Ohio counties.
U.S. Counties
The distribution is based on non-seasonally-adjusted data from 3,140 U.S. counties and county equivalents.
OH Value
(3.0%)
The regional value is compared to the Ohio State value.
US Value
(3.5%)
The regional value is compared to the national value.
Prior Value
(3.2%)
Prior Value compares a measured value with the previously measured value. Confidence intervals were not taken into account in determining the direction of the comparison.
Trend
This comparison measures the indicator’s values over multiple time periods.<br>The Mann-Kendall Test for Statistical Significance is used to evaluate the trend<br>over 4 to 10 periods of measure, subject to data availability and comparability.
County: Cuyahoga
Economy / Food Insecurity
Value
Compared to:
County: Cuyahoga Child Food Insecurity Rate
County: Cuyahoga Child Food Insecurity Rate
20.8%
(2021)
Compared to:
OH Counties
The distribution is based on data from 88 Ohio counties.
U.S. Counties
The distribution is based on data from 3,140 U.S. counties and county equivalents.
OH Value
(14.8%)
The regional value is compared to the Ohio State value.
US Value
(12.8%)
The regional value is compared to the national value.
Prior Value
(25.8%)
Prior Value compares a measured value with the previously measured value. Confidence intervals were not taken into account in determining the direction of the comparison.
Trend
This comparison measures the indicator’s values over multiple time periods.<br>The Mann-Kendall Test for Statistical Significance is used to evaluate the trend<br>over 4 to 10 periods of measure, subject to data availability and comparability.
County: Cuyahoga
Economy / Income
Value
Compared to:
County: Cuyahoga Income Inequality
County: Cuyahoga Income Inequality
0.508
(2018-2022)
Compared to:
OH Counties
The distribution is based on data from 88 Ohio counties.
U.S. Counties
The distribution is based on data from 3,133 U.S. counties and county equivalents.
OH Value
(0.466)
The regional value is compared to the Ohio State value.
US Value
(0.483)
The regional value is compared to the national value.
Trend
This comparison measures the indicator’s values over multiple time periods.<br>The Mann-Kendall Test for Statistical Significance is used to evaluate the trend<br>over 4 to 10 periods of measure, subject to data availability and comparability.
County: Cuyahoga
Economy / Poverty
Value
Compared to:
County: Cuyahoga Families Living Below Poverty Level
County: Cuyahoga Families Living Below Poverty Level
11.8%
(2018-2022)
Compared to:
OH Counties
The distribution is based on data from 88 Ohio counties.
U.S. Counties
The distribution is based on data from 3,104 U.S. counties and county equivalents.
OH Value
(9.3%)
The regional value is compared to the Ohio State value.
US Value
(8.8%)
The regional value is compared to the national value.
Trend
This comparison measures the indicator’s values over multiple time periods.<br>The Mann-Kendall Test for Statistical Significance is used to evaluate the trend<br>over 4 to 10 periods of measure, subject to data availability and comparability.
County: Cuyahoga
Education / Student Performance K-12
Value
Compared to:
County: Cuyahoga High School Graduation
County: Cuyahoga High School Graduation
88.5%
(2021-2022)
Compared to:
OH Counties
The distribution is based on data from 88 Ohio counties.
OH Value
(91.6%)
The regional value is compared to the Ohio State value.
US Value
(86.5% in 2020)
The regional value is compared to the national value. The source for the national value is National Center for Education Statistics
Prior Value
(87.3%)
Prior Value compares a measured value with the previously measured value. Confidence intervals were not taken into account in determining the direction of the comparison.
Trend
This comparison measures the indicator’s values over multiple time periods.<br>The Mann-Kendall Test for Statistical Significance is used to evaluate the trend<br>over 4 to 10 periods of measure, subject to data availability and comparability.
HP 2030 Target
(90.7%)
